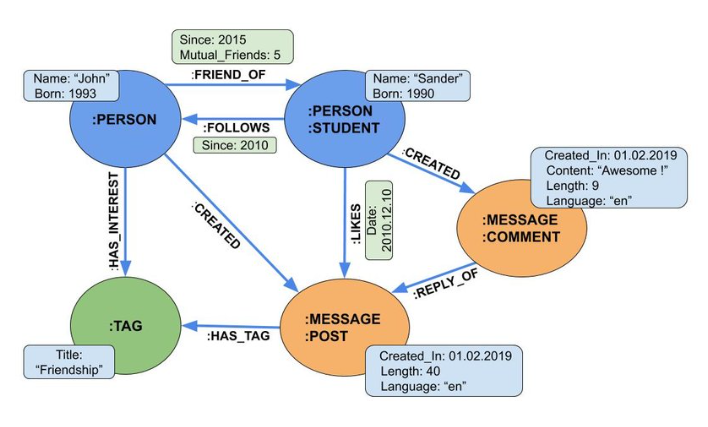
A property graph is a type of graph model where relationships not only are connections but also carry a name and some properties. They provide a richer view on how data can be modeled over many different databases as well as how different kinds of metadata relate. Figure 1. illustrates an example of a property graph model.
Property graphs are an extremely popular type of graph model, so it is worth having a good understanding of what they are and how they differ from other commonly used graph models. As well as being widely used in Knowledge Graph implementations, they can also be used to represent things like IoT (Internet of Things) networks, social networks and financial transactions.
The Structure of a Property Graph
A property graph is a graph data structure that consists of nodes, edges, and properties. Each node represents an entity or object, each edge represents a relationship between entities, and each property represents a characteristic of an entity or a relationship. The model is used in graph databases to represent and store data in a highly flexible and scalable manner. One of the advantages of property graphs is their flexibility and scalability. Since they can represent any kind of data and relationships, they can be used to model a wide variety of scenarios. In addition, property graphs can handle large amounts of data and scale horizontally across multiple machines, making them suitable for big data applications.
The nodes in a property graph can represent anything from people, places, things, or concepts. Nodes can be labelled to indicate their type or class and can also have one or more properties associated with them. For example, a node labelled “Person” might have properties like “Name”, “Age”, “Address”, “Occupation”, etc. Properties can have different data types, such as strings, numbers, dates, or even complex data structures like arrays or maps. The edges in a property graph represent relationships between nodes. Edges can be labelled to indicate the type of relationship and can also have properties associated with them. For example, an edge labelled “Follows” might have a property like “Since: 2010”, which indicates that two persons follow each other since 2010.
One of the key features of property graphs is that they allow for properties to be attached to both nodes and edges. This allows for a rich and expressive data model where relationships can have characteristics of their own, such as timestamps or ratings. This makes it possible to represent complex data structures with high accuracy and detail. In addition to nodes, edges, and properties, property graphs also support indexes and queries. Indexes are used to speed up queries and enable efficient retrieval of data. Queries in property graphs are expressed using a query language, such as Cypher or Gremlin, which allows for powerful querying capabilities that can traverse the graph in various ways.
Another advantage of property graphs is their ease of use. The query languages used in property graphs, such as Cypher and Gremlin, are designed to be user-friendly and intuitive, making it easy for developers and analysts to write and execute queries. Because of their ease of use, flexibility and scalability, property graphs are widely used in many industries and domains, including social networks, e-commerce, finance, and recommendation systems. They are particularly useful for representing and analysing highly connected and complex data, such as social networks or supply chain networks.